Welcome to the website of Science Dynamics - a project of Proverbs, a.s.
")
")

Call us
+ ( 420 ) 603 40 77 11
Science Dynamics
Hits: 6058
Trinitary diagrams
The trinitary diagrams are the invention of our esteemed colleague, Prof. Dr. Marek Susta. Marek created the trinitary diagram design when conceptualizing the dynamics of heterogeneous psychiatric-psychological problems for situations in which it was impossible or inconvenient to use causal loop diagrams. The idea of the trinitary diagram is based on his philosophical postulate that the dynamics of any system is expressible by the interaction of three (directly) independent variables. But the idea of the key meaning of the trinity in mundum creatum is much older.
As Marek says with a smile and a modesty of his own, the idea is strongly present in the work of his predecessor J. A. Comenius and in hints in the texts of even earlier authors, the ancient philosophers Socrates and Aristotle. The attentive reader will also discover traces of this idea in the writings of the notoriously half-hearted Plato, who not infrequently turned his readers' attention to one or two (on average, one and a half) causes of the phenomena he described. Pythagoras's legacy Marek rejects with a dismissive hand gesture...

Figure 1 - Graphical appearance of a trinitarian diagram, composed of three domains of three elements, defined by three elements...
The diagram used in this article is from the field of Marek's Systems Psychotherapy*, but the schema is applicable in all fields in which causal loop diagrams are applied - to any dynamic system. The variables are intentionally rendered unreadable with the exceptions noted; the specific content of your diagrams is, as is our custom, to be determined by you.
Unlike a causal loop diagram, a trinitary diagram does not work with information links. The links between the system's elements are only indicated by geometric shapes, or remain tacit. The diagram consists of three layers, zero (0), minus one (-I) and minus two (-II). The zero layer is made up of precisely three domains that express the top-level regions of the system being described. The example in Figure 1 is a view of the human being, which for the purposes of finding an answer to the question posed ( not explicitly stated here) consists of the domains of body, soul and spirit (corpus, anima et spiritus).
*not to be confused with "systemic psychotherapy"
At the -II level, three variables are again defined whose interaction determines the dynamics of the variable at the -I level. For the variables of a trinitary diagram (TD) the same rules apply as for causal loop diagrams (CLD). Only the domains can be named arbitrarily, from the -I level onwards the principle of scalability of variables must be respected. In other words, all variables must be expressible as a number on a scale from x-y, must not be binary (0-1,yes-no, etc.) and must not be superlatives ("best ..." "lowest ..."). The same rules apply to both hard and soft variables. Soft variables (feelings, effects of something on something, etc.) must take values on a fixed scale (e.g. <0;100> ). In addition, all variables must pass the "equation" test - the value of the variable at level -I must be calculable using the variables listed at the vertices of the triangle at level -II. If you find yourself unable to create a trinitarian diagram of the problem under these conditions, reformulate the assignment, provide a new, unbiased perspective by discussing it with colleagues or friends, and keep going until you succeed. If, despite your best efforts, the trinitarian diagram remains incomplete or imperfect, there is no point in embarking on the creation of a CLD, much less a simulation model.
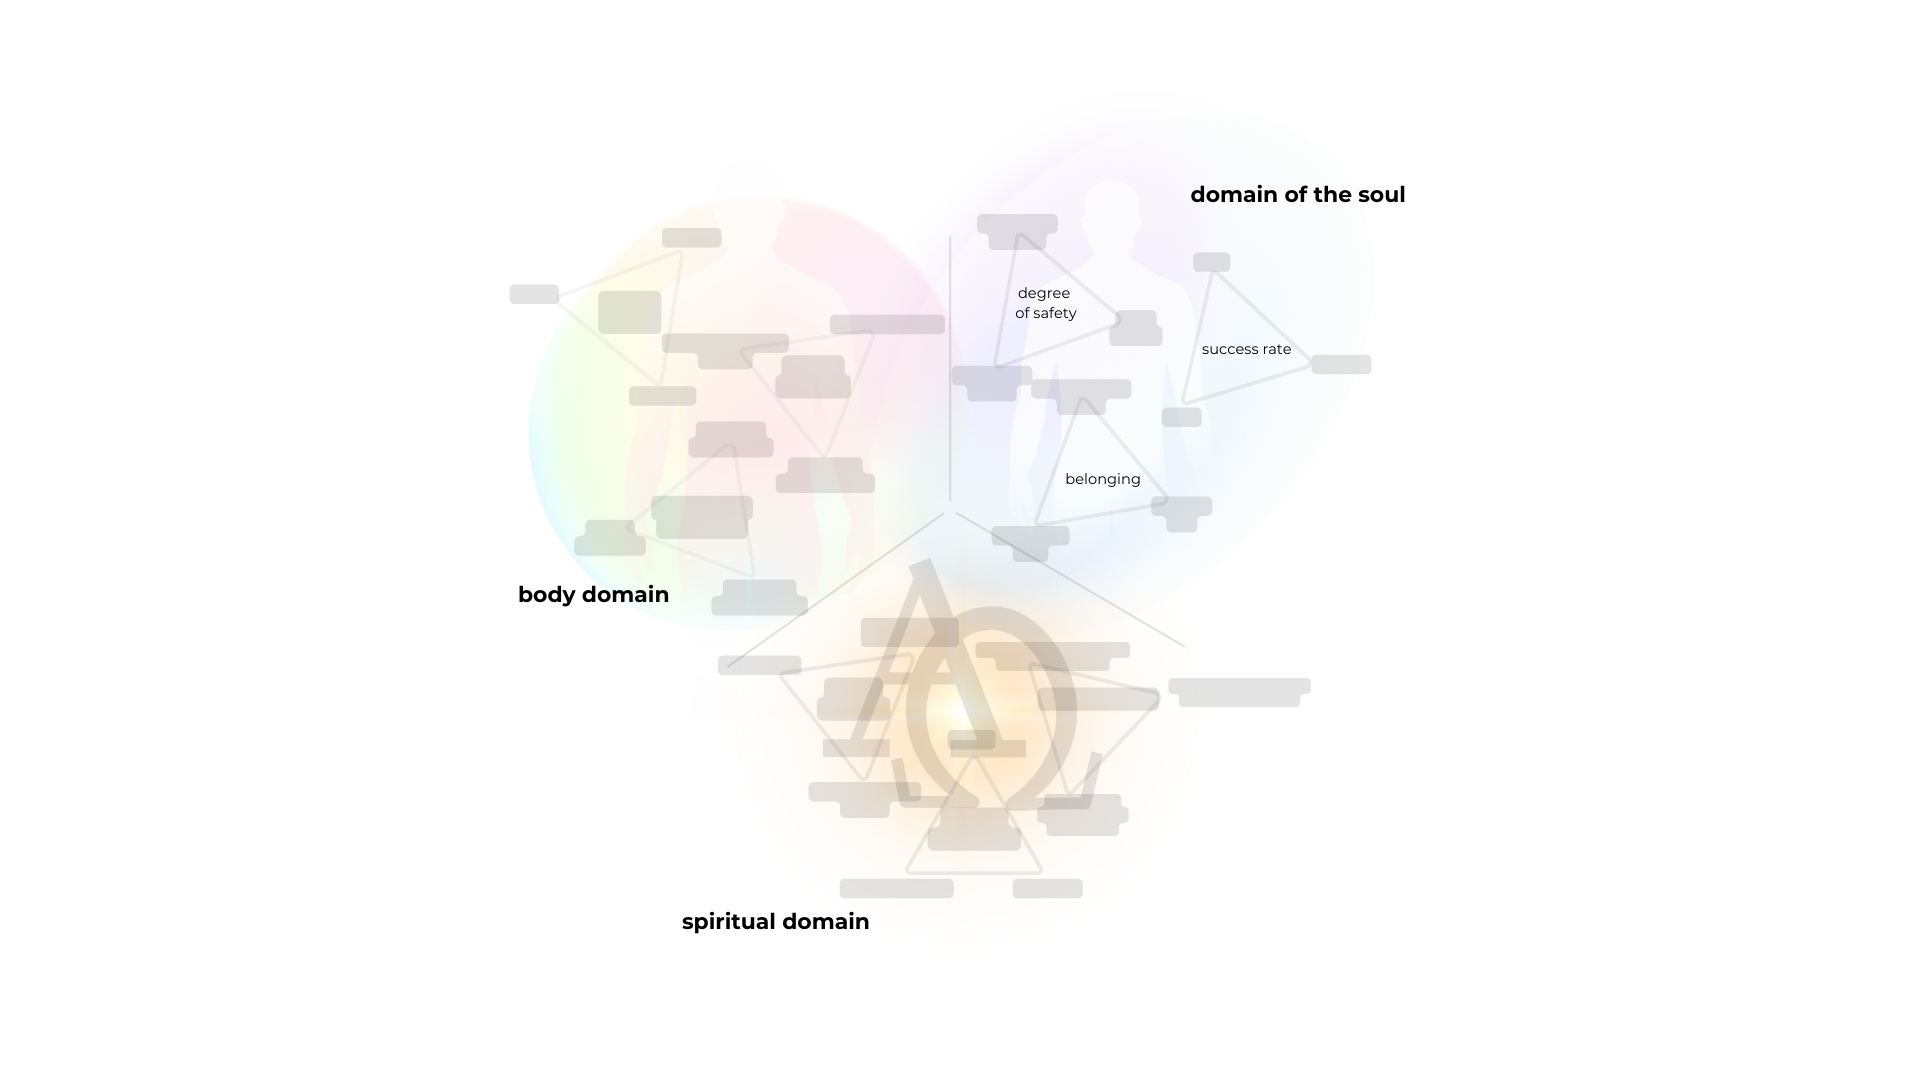
Figure 2 - Soul Domain Variables.
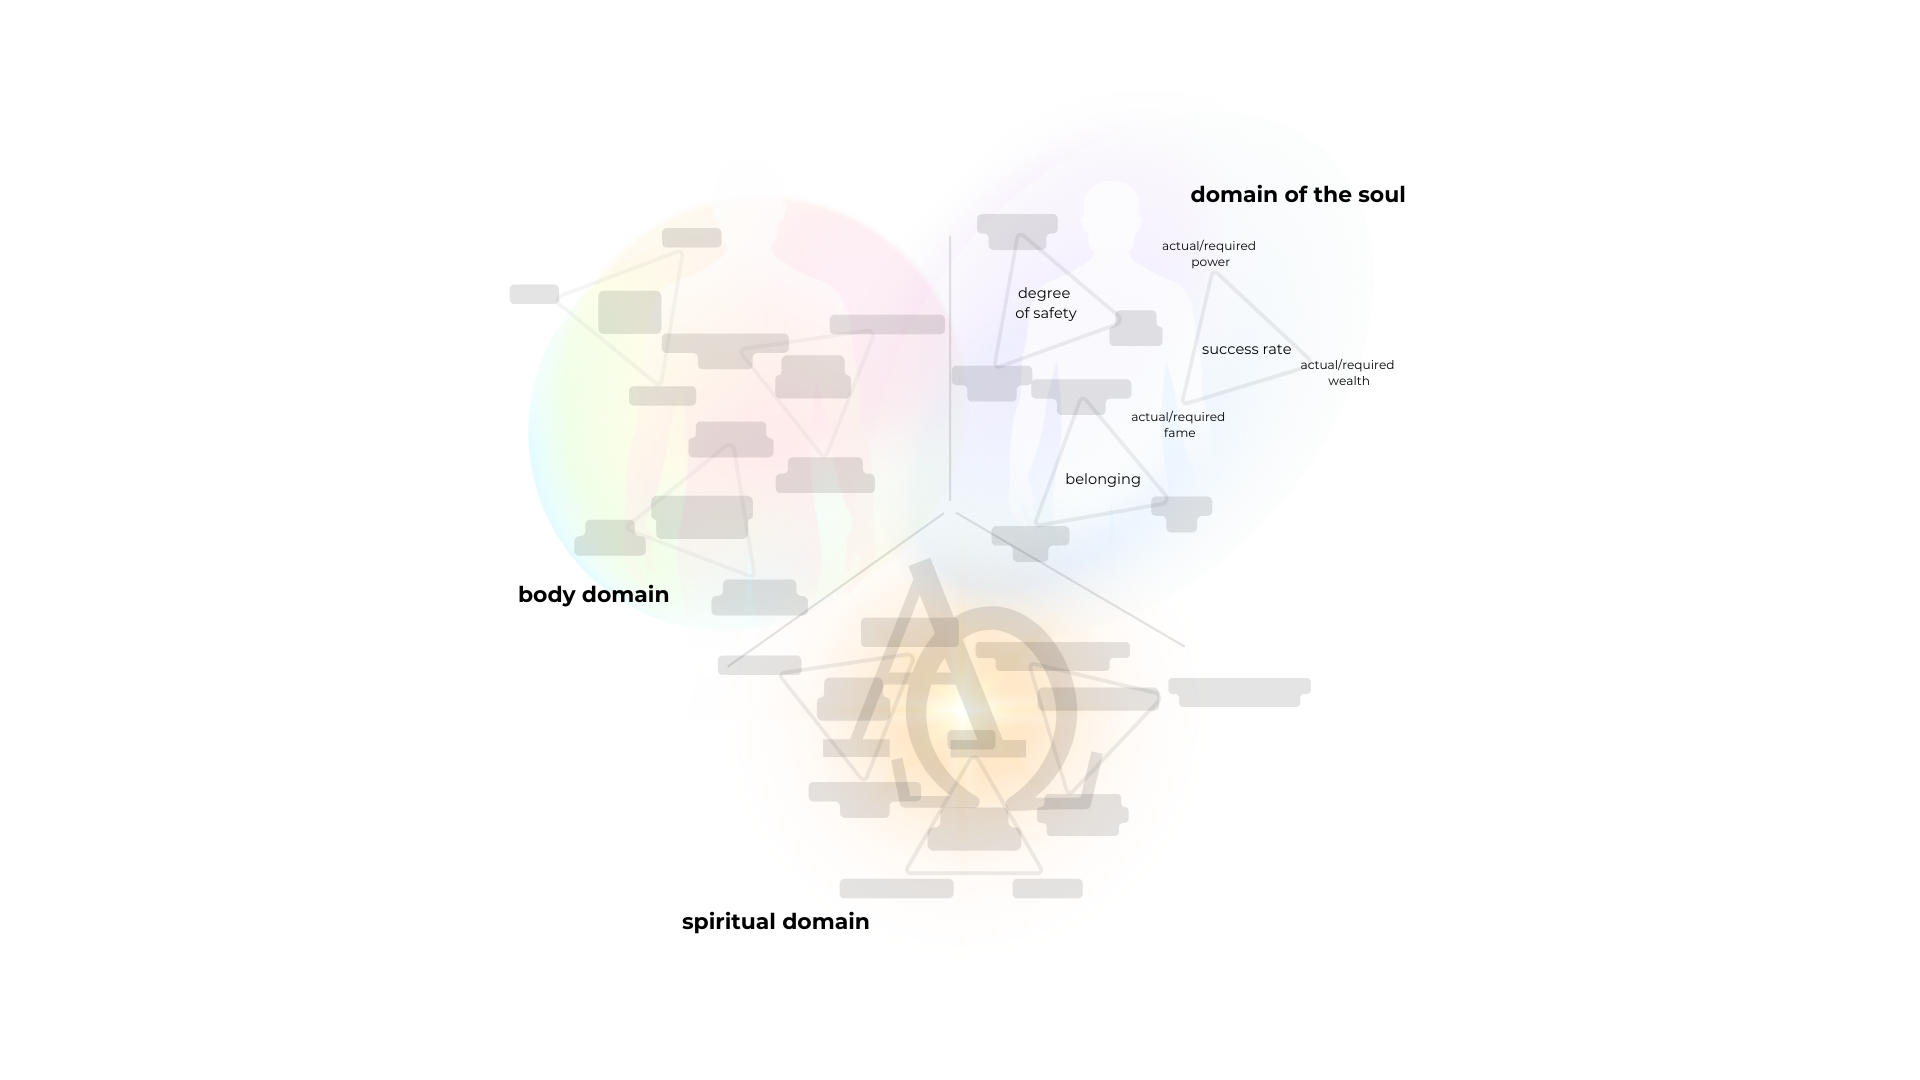
Figure 3 - Soft variable "success" of level -I and source variables of level -II.
In the example in Figure 3, the detail shows that success is influenced by power, fame and wealth. Note, however, that the variables at all levels are defined (formulated) to make sense on their own, without the need to know any other exogenous values. For example, if mere "wealth" were at the apex of the success triangle, one would need to know not only its actual value but also the value desired by the individual, or at least the value generally considered to be the limit of financial performance, in order to calculate the value of overall success. Power is therefore defined as the ratio between the actual power achieved and the desired level of power - it is thus sensu stricto a ratio. The same applies to the other variables. For the soft variables it must be obvious that they take values between 0 and, say, 100 (or <0;1>), for the others it is a percentage of the ratio of reality to plan. Although this can be continued ad infinitum, the trinitary diagram development ends at this level. At the point when its creator is satisfied with the form it takes, the creator uses it as the basis for the subsequent design of the causal loop diagram, which, thanks to the trinitary diagram, begins to form with the extensional boundaries defined and the desired level of detail clearly specified. If you create a TD before creating a CLD, it is virtually impossible to subsequently obtain a cluttered jumble of disparate relationships and layer-incompatible variables; the number of key variables will also not exceed 27+9 (33+32).
The accuracy of the selection (and formulation) of variables should be verified at each step. Ask first in what units the variable at -I level will be measured. Then write an equation to calculate it. The equation must also make sense in terms of units. In our example, the unit of success rate is percentages. The target value that represents the achievement of the desired success is 100%. A higher value is of course possible, it means exceeding the target. The equation for calculating the variable "success rate" might look like this: success rate = (actual power/desired power + actual wealth/desired wealth + actual fame/desired fame)*100/3, where success rate will be the arithmetic or perhaps weighted average of the values of the level -II variables. We can play around with the equation, we could easily write it like this: success rate = MIN((actual power/required power*100 + actual wealth/required wealth*100 + actual fame/required fame*100), where we will only consider the lowest of the achieved goals, etc. as the result.
If you want to try it out, you can download a blank pdf version by clicking the button beneath this text. Work with the file ad libitum, if you cover up the copyright for any reason, Marek will most likely not sue you. However, if you mention the source in your references, it will make him happy. We wish you much success in conceptualizing your ideas.
I. Aur; prof. doc. Marek Susta, PhD. et PhD. MD, MBA, MA